Python Program to calculates the values of a function and draws a diagram
Example
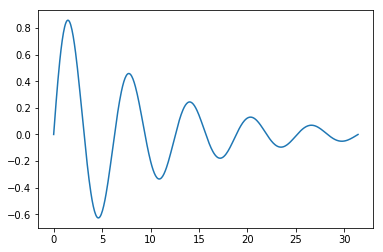
#!/usr/bin/env python3
# -*- coding: utf-8 -*-

from numpy import linspace, sin, exp, pi
import matplotlib.pyplot as mp
# calculate 500 values for x and y without a for loop
x = linspace(0, 10*pi, 500)
y = sin(x) * exp(-x/10)
# make diagram
mp.plot(x,y)
mp.show()
Output
Explanation
Once you have calculated the many function values, it would be nice to display them in a diagram. This is very simple if you use Matplotlib, the standard Python plotting library.